Shift in correlation
Description
This function simulates a 2D signal of Gaussian i.i.d. random variables with zero mean and covariance matrix alternating between \([[1, 0.9], [0.9, 1]]\) and \([[1, -0.9], [-0.9, 1]]\) at every change point.
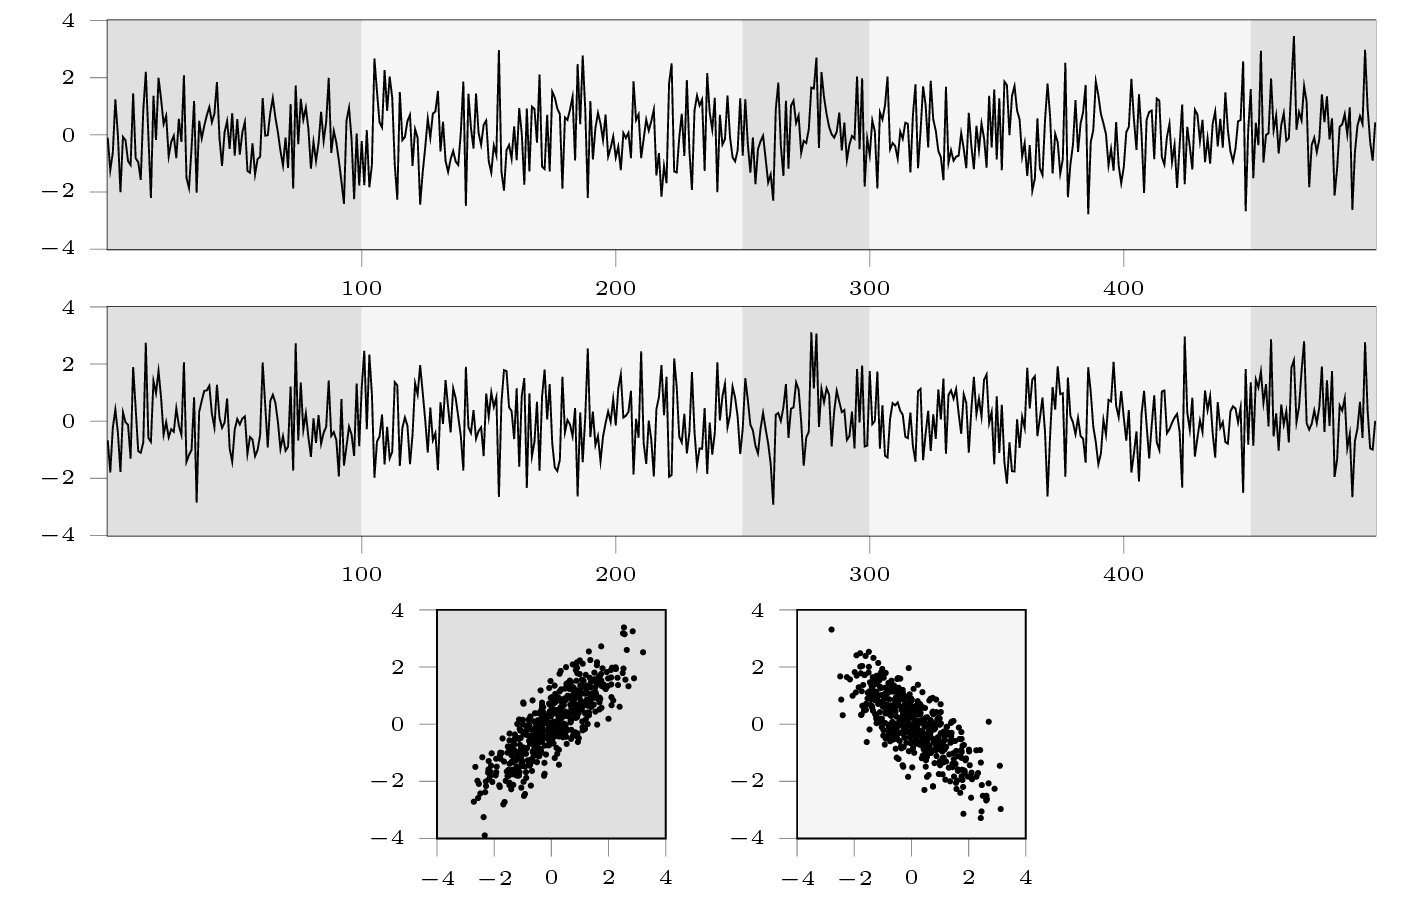
Top and middle: 2D signal example. Bottom: Scatter plot for each regime type.
Usage
Start with the usual imports and create a signal.
import numpy as np
import matplotlib.pylab as plt
import ruptures as rpt
# creation of data
n = 500, 3  # number of samples
n_bkps = 3  # number of change points, noise standart deviation
signal, bkps = rpt.pw_normal(n, n_bkps)
rpt.display(signal, bkps)
Code explanation
-
ruptures.datasets.pw_normal.pw_normal(n_samples=200, n_bkps=3)[source]¶ Return a 2D piecewise Gaussian signal and the associated changepoints.
- Parameters
n_samples (int, optional) – signal length
n_bkps (int, optional) – number of change points
- Returns
signal of shape (n_samples, 2), list of breakpoints
- Return type
tuple