Display
Description
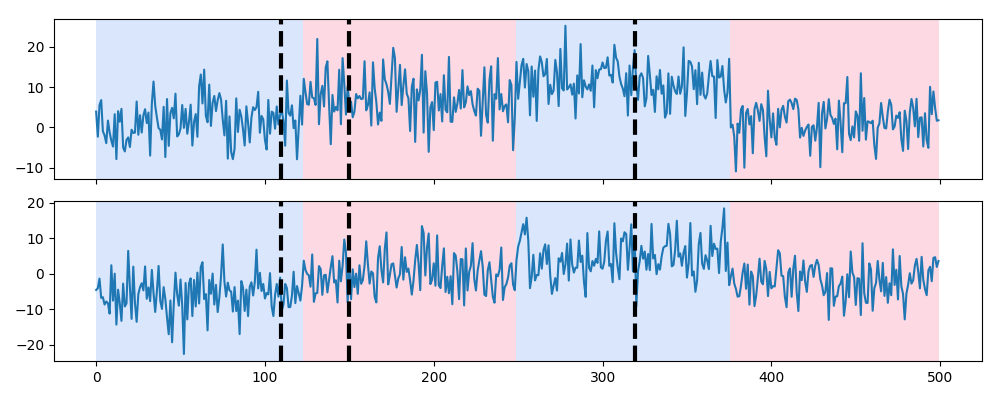
The function display() displays a signal and the change points provided in alternating colors.
If another set of change point indexes is provided, they are displayed with dashed vertical dashed lines.
Usage
Start with the usual imports and create a signal.
import numpy as np
import matplotlib.pylab as plt
import ruptures as rpt
# creation of data
n, dim = 500, 2  # number of samples, dimension
n_bkps, sigma = 3, 5  # number of change points, noise standart deviation
signal, bkps = rpt.pw_constant(n, dim, n_bkps, noise_std=sigma)
rpt.display(signal, bkps)
If we computed another set of change points, for instance [110, 150, 320, 500], we can easily compare the two segmentations.
rpt.display(signal, bkps, [110, 150, 320, 500])
Code explanation
-
ruptures.show.display.display(signal, true_chg_pts, computed_chg_pts=None, **kwargs)[source]¶ Display a signal and the change points provided in alternating colors. If another set of change point is provided, they are displayed with dashed vertical dashed lines. The following matplotlib subplots options is set by default, but can be changed when calling display): - “figsize”: (10, 2 * n_features), # figure size
- Parameters
signal (array) – signal array, shape (n_samples,) or (n_samples, n_features).
true_chg_pts (list) – list of change point indexes.
computed_chg_pts (list, optional) – list of change point indexes.
**kwargs – all additional keyword arguments are passed to the plt.subplots call.
- Returns
(figure, axarr) with a
matplotlib.figure.Figureobject and an array of Axes objects.- Return type
tuple