Hausdorff metric
Description
The Hausdorff metric measures the worst prediction error. Assume a set of change point indexes \(t_1,t_2,\dots\) and their estimates \(\hat{t}_1, \hat{t}_2,\dots\). The Hausdorff metric is then equal to
\[\text{Hausdorff}(\{t_k\}_k, \{\hat{t}_k\}_k) := \max \{ \max_k \min_l |t_k - \hat{t}_l| \, , \max_k \min_l |\hat{t}_k - t_l|\}.\]
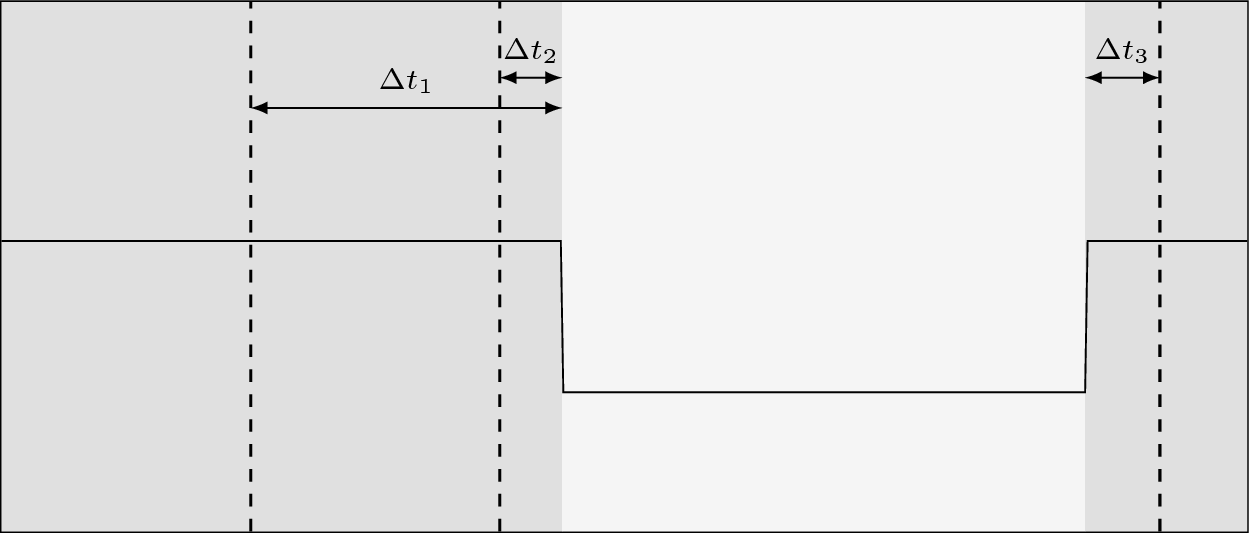
Schematic example: true segmentation in gray, estimated segmentation in dashed lines. Here, Hausdorff is equal to \(\max(\Delta t_1, \Delta t_2, \Delta t_3)\).
Usage
Start with the usual imports and create two segmentations to compare.
from ruptures.metrics import hausdorff
bkps1, bkps2 = [100, 200, 500], [105, 115, 350, 400, 500]
print(hausdorff(bkps1, bkps2))