Rand index
Description
The Rand index measures the similarity between two segmentations. Formally, for a signal \(\{y_t\}_t\) and a segmentation \(\mathcal{S}\), denote by \(A\) the associated membership matrix:
\[\begin{split}\mathcal{A}_{ij} &= 1 \text{ if both samples } y_i \text{ and } y_j \text{ are in the same segment according to } \mathcal{S} \\ &= 0 \quad\text{otherwise}\end{split}\]
Let \(\hat{\mathcal{S}}\) be the estimated segmentation and \(\hat{A}\), the associated membership matrix. Then the Rand index is equal to
\[\frac{\sum_{i<j} \mathbb{1}(A_{ij} = \hat{A}_{ij})}{T(T-1)/2}\]
where \(T\) is the number of samples. It has a value between 0 and 1: 0 indicates that the two segmentations do not agree on any pair of points and 1 indicates that the two segmentations are exactly the same.
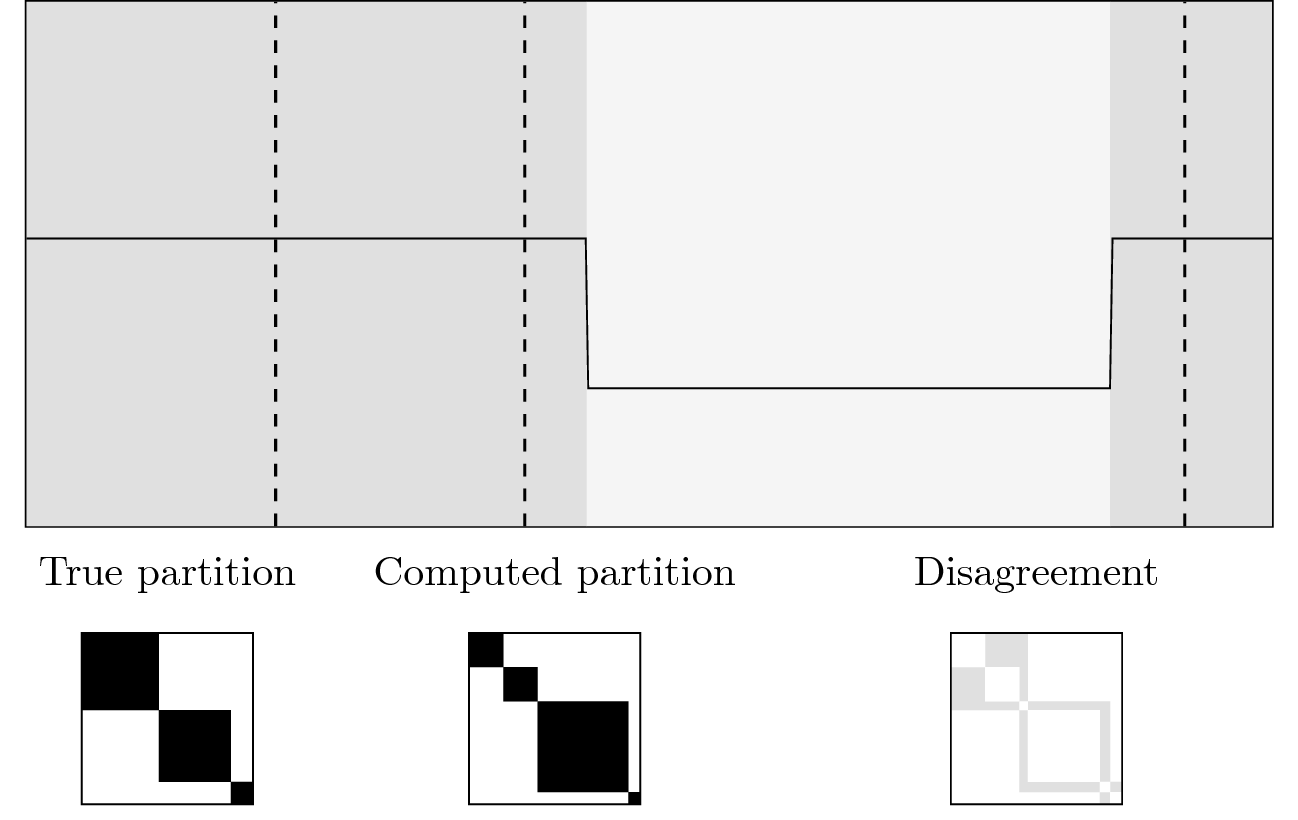
Schematic example: true segmentation in gray, estimated segmentation in dashed lines and their associated membership matrices. Rand index is equal to 1 minus the gray area.
Usage
Start with the usual imports and create two segmentations to compare.
from ruptures.metrics import randindex
bkps1, bkps2 = [100, 200, 500], [105, 115, 350, 400, 500]
print(randindex(bkps1, bkps2))